Creating a profit-driven team: The metrics your auto shop needs to track
August 08, 2024
Shop Tips & Best Practices
9 min read
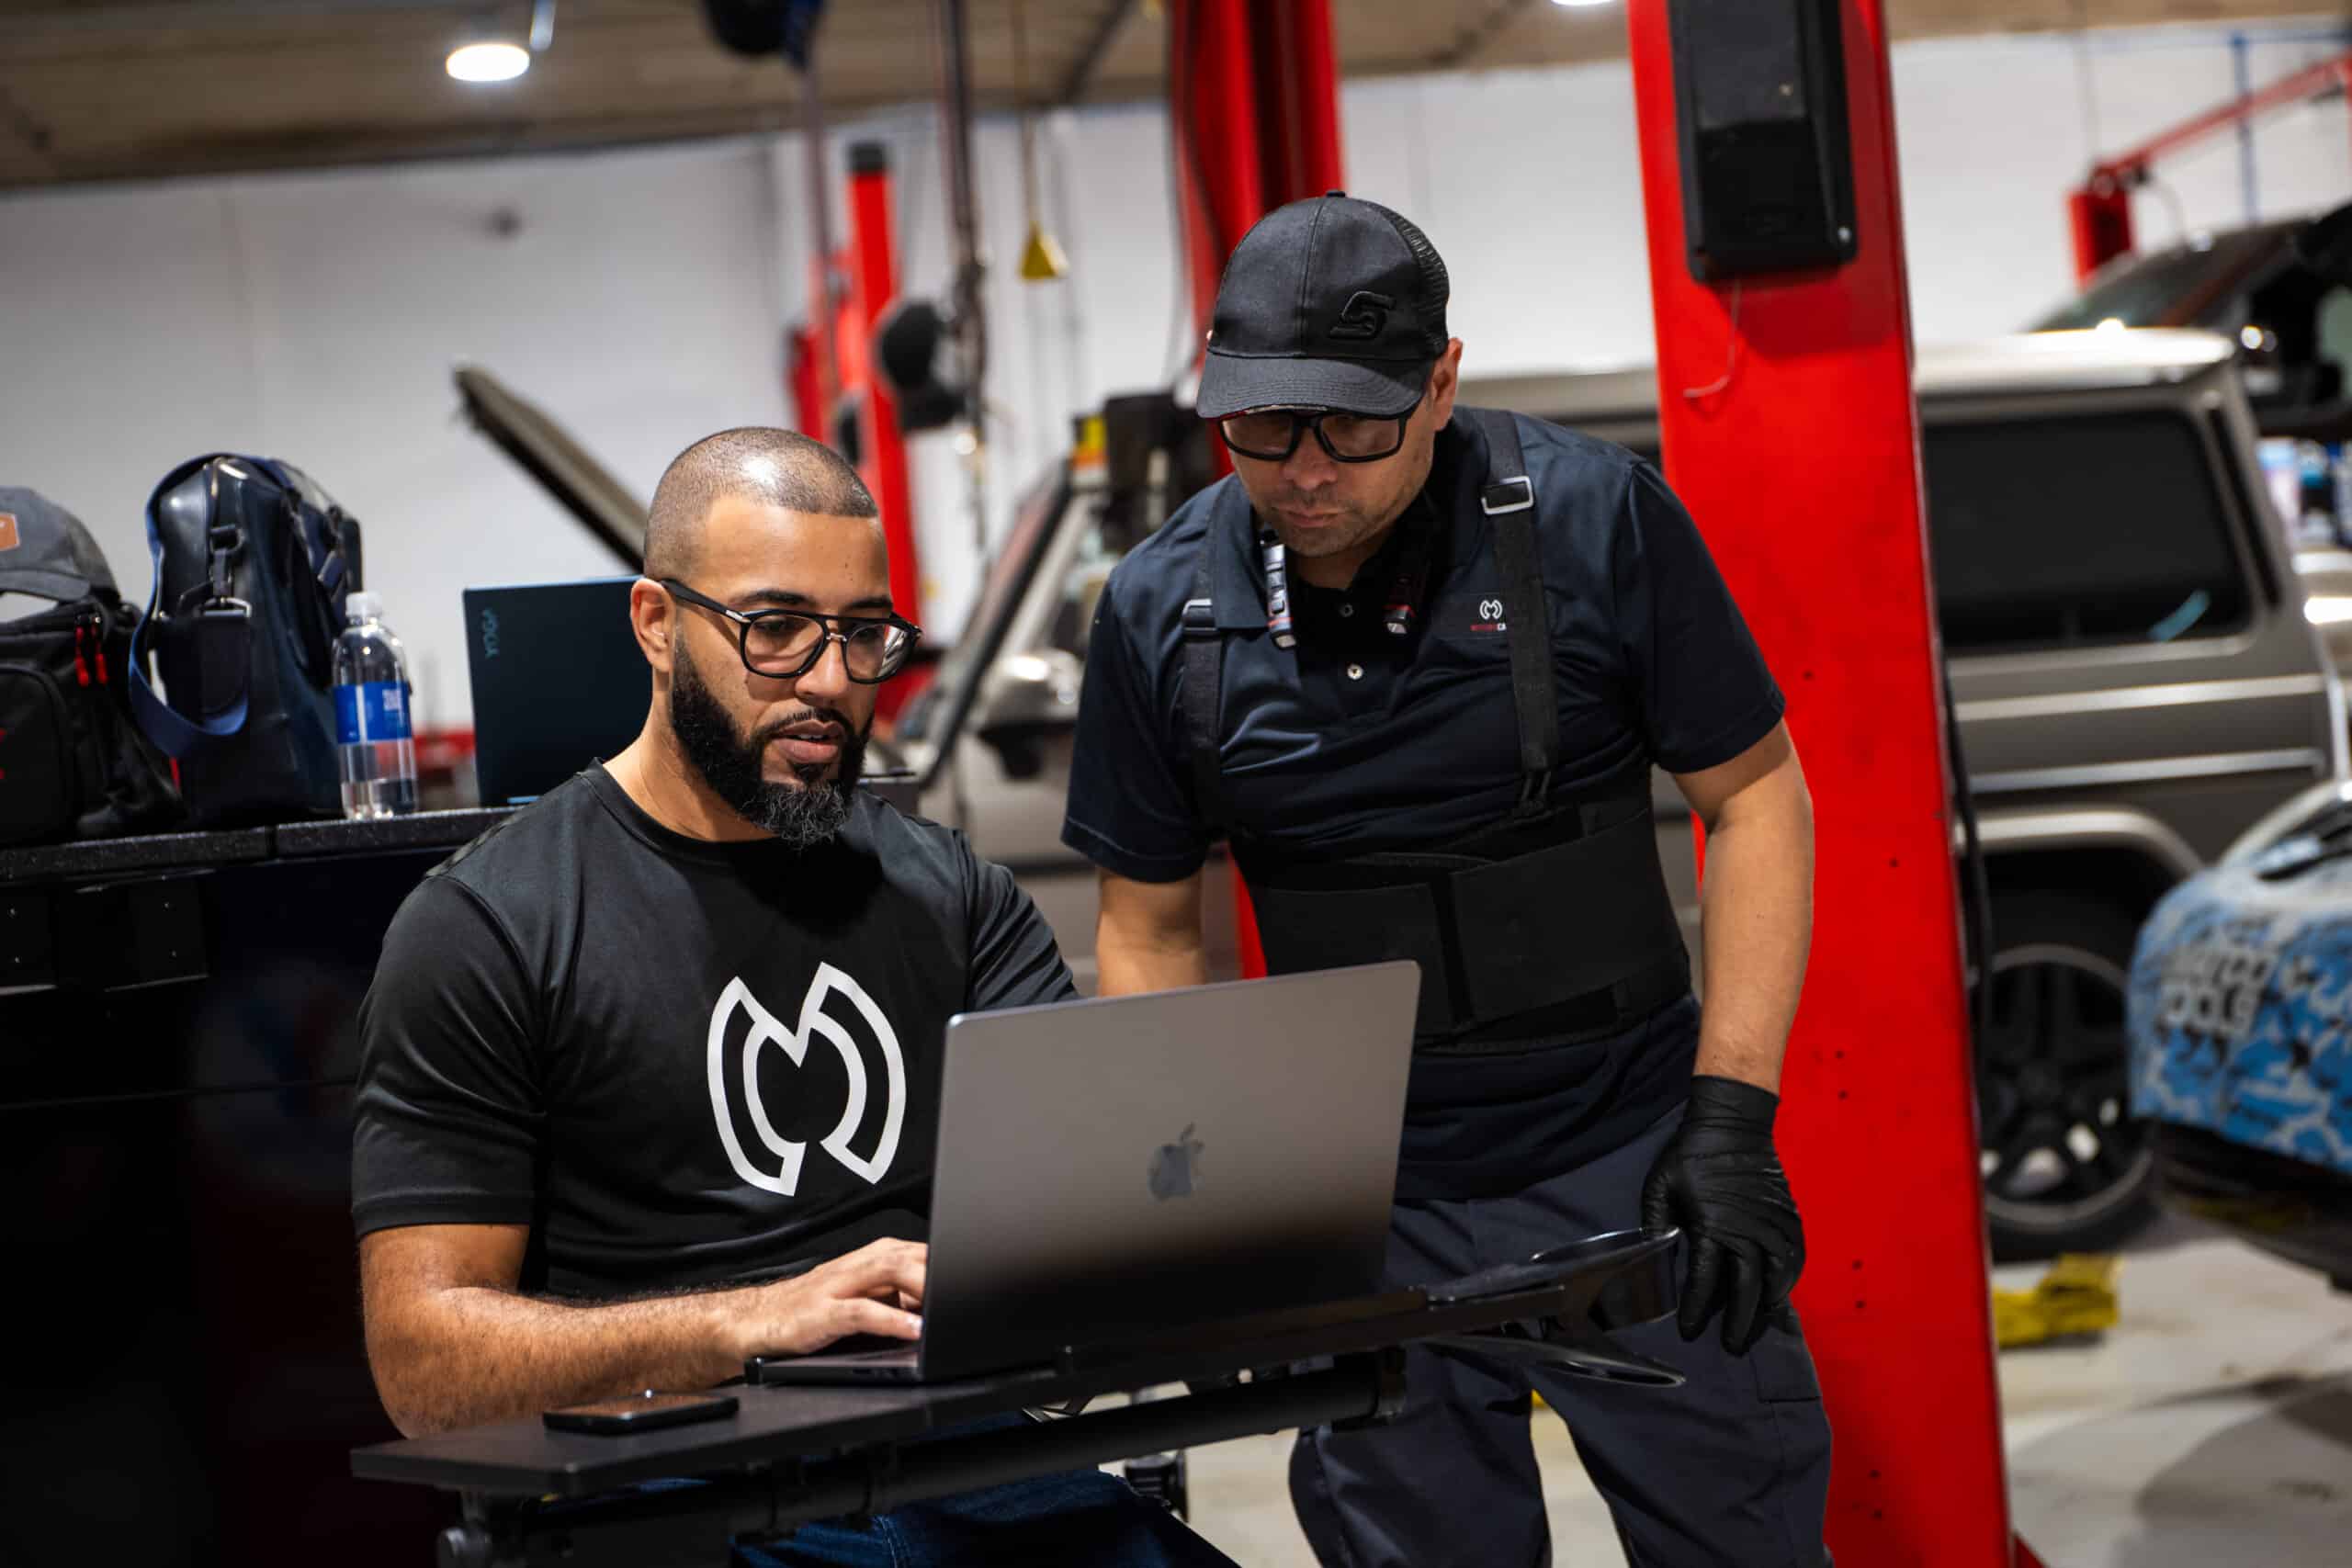
As both a shop owner and a coach for the Automotive Coaching and Training (ACT) Group, Dave Kusa believes that running a profitable auto repair shop requires more than just technical expertise and exceptional customer service. To truly thrive, shop owners must have a firm grasp on their financials and foster a culture of financial transparency and accountability within their team.
I’m a firm believer that if the team knows what the financials look like for the shop, then they have a better understanding of the goals we’re shooting for.”
Dave Kusa, Coach, The ACT Group; Shop Owner, Autotrend Auto Repair
When your team understands what drives profits and where the net profit goes, everyone can work together to create a profitable business. (Click here to learn more about why Dave recommends that shops have financial transparency with their employees and how to get started.)
To have financial transparency with your team, you must regularly track specific metrics to keep a pulse on your shop’s performance and have the opportunity to make adjustments to maximize profits.
In our recent webinar, Dave Kusa joined us to share more about financial transparency in auto shops and provided a helpful list of metrics he recommends every shop should track. Here’s a summary of his recommendations:
Essential metrics to track and share with your team to create a profit-driven shop
Profit and Loss Statement (P&L)
A Profit and Loss (P&L) statement summarizes the revenues, costs, and expenses incurred during a specific period. Here’s a breakdown of the key components of a P&L statement:
Key components of a P&L statement
Sales Income
- Labor: Revenue from labor charges
- Parts: Revenue from selling parts
- Sublet: Revenue from sublet services like outsourced work
- Hazmat Fees: Revenue from hazardous material handling fees
Cost of Goods Sold (COGS)
- Labor Costs: The wages paid to technicians for their labor
- Parts Costs: The cost of the parts sold
- Sublet Costs: The cost associated with sublet services
- Hazmat Costs: Costs related to handling hazardous materials
Gross Profit
Calculated as Sales Income minus COGS.
Note from Dave: “Gross profit indicates how efficiently your shop converts sales into profit after direct costs. It’s critical to the shop’s pricing strategy and cost management. Achieving a high gross profit requires careful management of both parts and labor costs, ensuring that all parts and labor are correctly billed on repair orders.”
Expenses
- Fixed Expenses: Rent, utilities, insurance, salaries (non-technician staff), and other regular expenses
- Variable Expenses: Marketing costs, supplies, repairs, and other costs can fluctuate
Net Profit
Calculated as Gross Profit minus Operating Expenses.
Not from Dave: “Net profit reflects the overall profitability of the shop after all expenses. It is a crucial indicator of the business’s financial health and long-term viability. Aiming for a net profit of around 20% is ideal, though industry averages may be lower. Regularly reviewing net profit helps ensure the business is financially sustainable.”
Why understanding a P&L statement is important
- Financial transparency and accountability: Sharing the P&L with your team demystifies the shop’s financials and helps employees understand financial goals, money flow, and essential practices.
- Informed decision-making: This enables you to make informed decisions on pricing, cost management, and investments, identifying areas for efficiency improvement and unnecessary expense cuts.
- Operational efficiency: Regular analysis helps track key metrics like parts and labor gross profit, ensuring your shop operates efficiently and maximizes profitability.
- Profitability and growth: Provides a clear picture of your shop’s profitability, aiding in setting realistic financial goals, planning for growth, and maintaining long-term sustainability.
- Budgeting and financial planning: Helps in budgeting for future expenses and planning financial strategies, providing a roadmap for achieving financial objectives.
- Identifying trends and making adjustments: Regular review helps identify trends in income and expenses, allowing for adjustments to strategies to address negative trends before they impact the business significantly.
Beyond the P&L — What metrics to track daily, weekly, and monthly
As shown above, your P&L provides a ton of great information that helps you to look at the past and make adjustments for the future. Still, it’s incredibly important to look at certain metrics on a daily and weekly basis so that you can make daily and weekly adjustments to achieve a healthy month.
Note from Dave: “If I’m looking at these things on a weekly and daily basis, I can understand the trends and fix them today. Six weeks from now, when I’m looking back, I can’t understand or fix it.”
Here are the key metrics Dave recommends shops track on a daily, weekly, and monthly basis:
Daily Metrics
Parts Gross Profit: Parts gross profit is one of the easiest key performance indicators (KPIs) to control and directly impacts your shop’s overall profitability. Tracking this daily ensures that your pricing strategies are effective and that you’re not undercharging for parts.
Note from Dave: “The easiest singular KPI to control in your shop is parts gross profit because you can literally control it on every part. Parts income should be maximized using a robust parts pricing matrix to ensure a high gross profit margin, ideally around 60%. I consistently achieve 65% parts gross profit in my shop.”
Gross Profit per Repair Order: Ensuring each repair order meets the desired gross profit margin helps maintain overall profitability. This metric highlights whether your shop is effectively managing labor and parts costs per job.
Note from Dave: “You need to ensure every repair order is sold at the right gross profit to avoid selling jobs at low margins.”
Car Count: Knowing how many cars are serviced daily helps you manage workflow and productivity. It ensures that your shop maintains a steady volume of business necessary to meet financial goals.
Weekly Metrics
Technician Productivity: Measuring how productive technicians are (billable hours vs. hours worked) helps optimize labor efficiency and identify areas for improvement. Higher productivity means more revenue generated per technician.
Note from Dave: “Productivity goals should be based on the time technicians are on the floor, aiming for 100% productivity as a minimum.”
Parts Gross Profit: Reviewing parts gross profit weekly helps identify trends or issues that might not be apparent on a daily basis. This allows for timely adjustments to pricing or purchasing strategies.
Note from Dave: “If your parts gross profit is lower than expected, address it immediately.”
Weekly Car Count: Tracking the number of cars serviced weekly provides a broader view of your shop’s workload and helps with scheduling and resource allocation to ensure your shop reaches its service capacity.
Average Dollars per Repair Order: This metric shows the average revenue generated from each repair order, helping to assess the effectiveness of upselling and the overall service mix. It is essential to ensure that your shop maximizes revenue opportunities.
Note from Dave: “Average dollars per repair order is a key indicator of our ability to upsell and provide comprehensive services.”
Monthly Metrics
Overall Gross Profit: Gross profit is a critical measure of your shop’s efficiency in converting sales into profit after direct costs. Tracking it monthly ensures that pricing strategies and cost management practices are effective.
Net Profit: Net profit shows your shop’s profitability after all expenses. Tracking this metric monthly helps ensure your business is financially healthy and meeting your profit targets. It’s a crucial indicator of the overall financial performance.
Total Sales: Total sales reflect your shop’s ability to attract and service customers. It is fundamental for assessing market demand and the effectiveness of sales strategies.
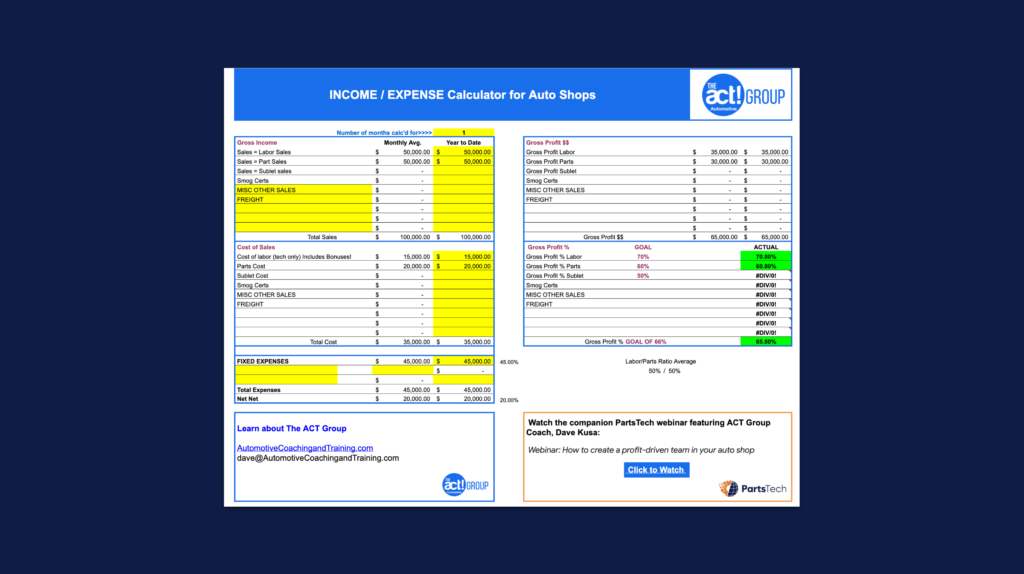
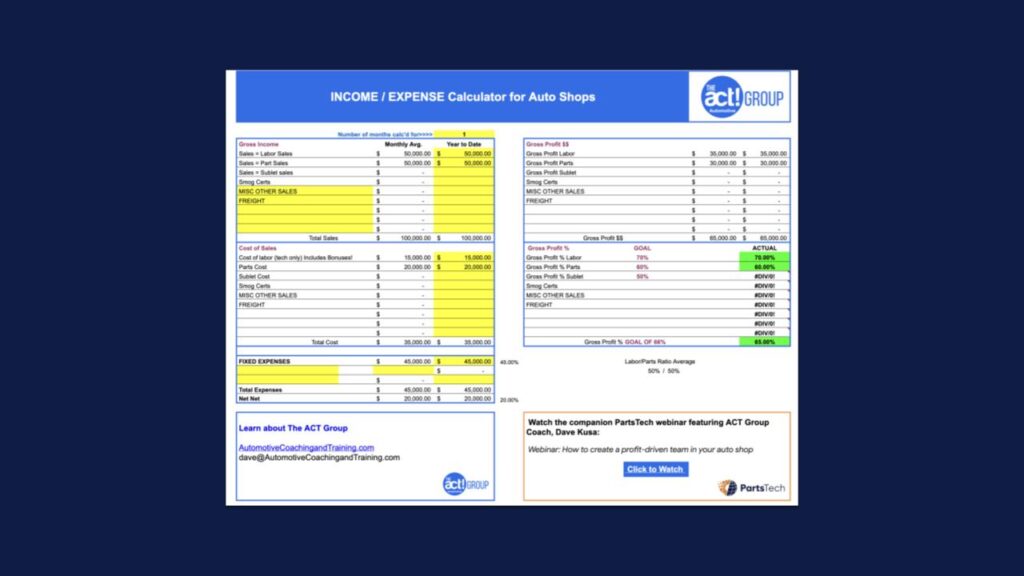
Hear Dave explain this information in detail in our on-demand webinar and download a free Income/Expense calculator from the ACT Group.
Webinar Q&A Followup
We received great questions during the webinar. For questions not addressed in the live session, here are Dave’s written responses:
What are the disadvantages of financial transparency?
“I don’t think there are any, as long as the information is presented correctly (watch the webinar for details).”
Is there a way to give a partial view of finances to my employees?
“I think it is important to share all the info with your entire team, especially the techs, as they are responsible for making sure all parts and supplies used to get to the repair order so we don’t give anything away. If the team understands the importance of this, they are better at making sure it happens. Remember, if we buy a part that does not make it to the repair order, that lost revenue comes directly out of net profit.”
We are overall transparent with our sales force but typically do not discuss dollars with the techs. We focus on hours with them. Our concern is that if they know the profit margins it might lead to them feeling “cheated” on certain jobs or overall. Thoughts on this?
“This is why it is important to present the information correctly. We need to explain that much of the net profit gets reinvested in the business to cover unexpected costs, not every dollar of net goes to the owner.”
Do you use your normal parts matrix for dealer parts as well?
“In my shop, we generally markup dealer parts at list price times 1.3. Of course, with high-priced parts, that may be too much, so we need to adjust. But we don’t use a lot of dealer parts. If you are using more dealer parts, then you must use some type of matrix, so we achieve the proper gross profit on parts.”
Can you give us a general benchmark of what net Profit should be in an average shop?
“The benchmark I use is 20%. This is very hard to achieve, but it can be reached with a lot of work.”
About Dave Kusa

Dave Kusa, owner of Autotrend Auto Repair, has over 34 years of experience in the automotive service aftermarket. After graduating from De Anza College Automotive Technology Program in Cupertino, CA, in 1984, he began working as a Diagnostic Technician, Shop Foreman, and Service Advisor. Dave accepted a position at Autotrend Diagnostics in 2000 and became the shop owner in 2001. He, his wife Judy, and daughters Katie and Kristi continue to run Autotrend as a family business.
After training with many of the best automotive business trainers, Dave hired Ray Kunz of the Automotive Coaching and Training Group to continue his education and move Autotrend Diagnostics to the next level. Dave is also very involved in the industry. He has worked with the Automotive Service Association (ASA) on the Mechanical Operations Committee, currently serves as the chair of the Automotive Service Councils of California’s (ASCCA) Government Relations Committee, and recently completed his term as the 2017 ASCCA State President.
Dave believes industry involvement, ongoing technical and shop management training, and education are critical to the continued success and growth of anyone in the automotive aftermarket industry, especially now that automotive technology is changing rapidly.
Dave’s words to live by are “adapt or become obsolete.”

You may also like
5 Keys to Maximizing Your Shop’s Profits
Running a repair shop means running a business, and that requires managing a budget, overseeing payroll, and, at the end of the day, turning a profit. However, …
Find Out More
5 Skills Every Service Writer Needs
In busy auto shops, service writers are the linchpins that keep repairs, parts, and people in sync. They translate customer concerns into repair orders, coordinate with technicians …
Find Out More
PartsTech’s Top 5 Time-Saving Features of 2025 (So Far!)
If you can believe it, we’re already over half-way through 2025! We’ve had an exciting year so far at PartsTech, from joining the OEC family to unveiling …
Find Out More