
The State Of General Auto Repair Shops In The United States – A Benchmark Report By PartsTech
February 08, 2024
Industry Trends & Insights
3 min read
It is a fabulous time to be part of the general automotive repair industry. The average age of vehicles on the road is 12.5 years, the highest ever, and the United States auto repair industry is projected to be valued at $250 billion by 2033*.
As the industry grows and the landscape shifts, your shop has an exciting opportunity to position itself to be part of this growth. Are you ready?
To help you plan and strategize for growth, PartsTech is thrilled to present a comprehensive benchmark report tailor-made for general auto repair shops in the United States.
The PartsTech Benchmark Report: Your Roadmap to Success
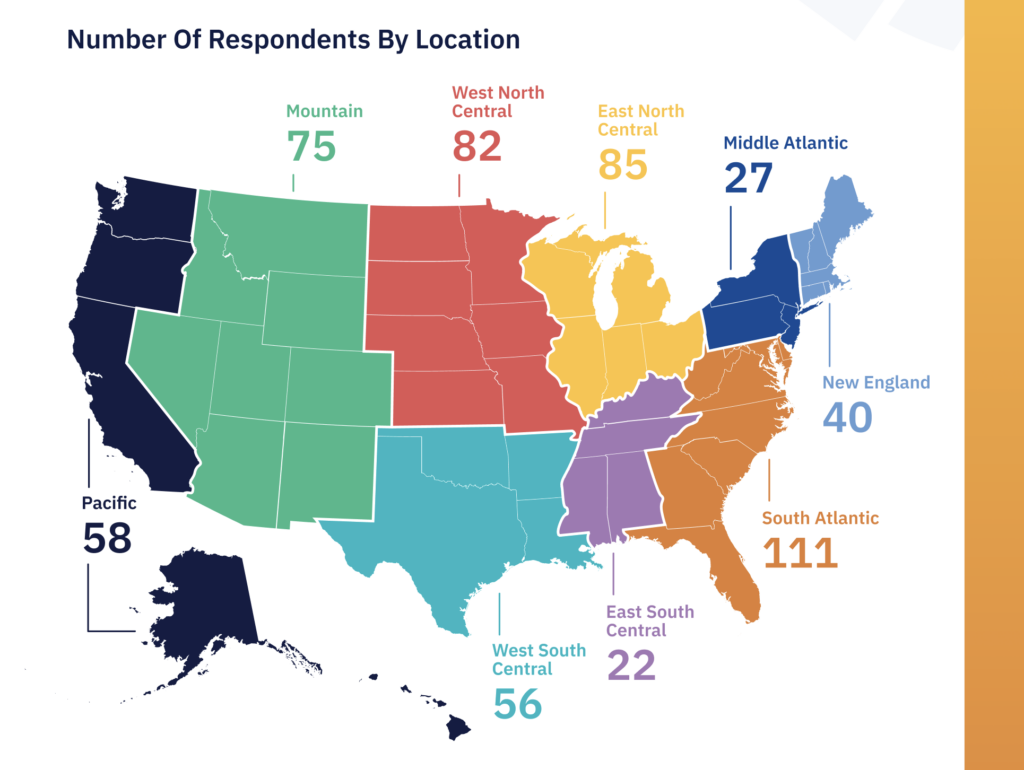
We surveyed 618 general auto repair shops across the United States. The State Of General Automotive Repair Shops In The U.S. report presents your benchmark data, trends, and key findings from shops just like yours. The purpose of this data is to help inspire and guide you with insights to steer your shop toward success today and into the future.
What’s Inside The Report
1 National Report + 9 Mini Regional Reports
Instead of categorizing survey respondents into the four main regions of the United States, we opted for a more granular approach, examining response trends within the nine Census Bureau divisions, as illustrated below.
This report unpacks national survey findings, trends, and overall benchmark data points of general auto repair shops. We encourage you to take a look at the national data first and then jump down to the mini report for your region.
These regional reports offer a clearer understanding of the typical makeup of shops in your area. Each report also includes data on the top ordered parts – pulled directly from PartsTech’s parts and tire ordering data for 2023.
Benchmark Numbers
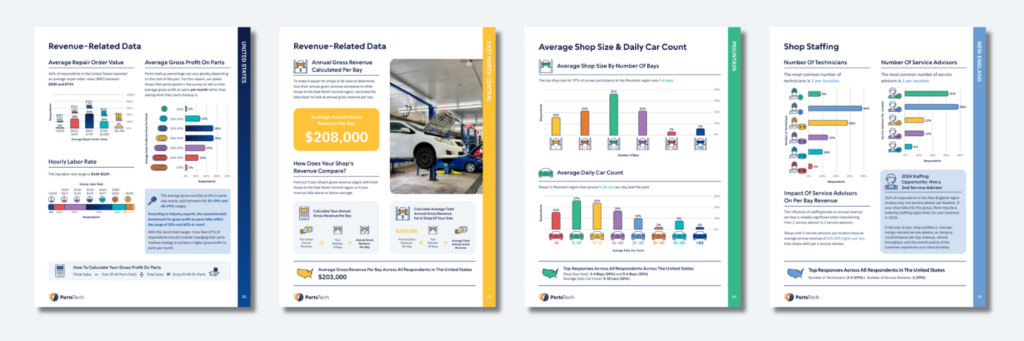
Revenue-Related Benchmark Data: Explore crucial metrics such as Annual Gross Revenue Per Bay, Average Repair Order Value (ARO), Average Gross Profit on Parts Per Month, and Average Labor Rate.
Shop Size, Daily Car Count, and Staffing: Understand the industry standards with data on the Average Number of Bays, Average Daily Car Count, Average Number of Technicians, and Average Number of Service Advisors.
Insights And Key Findings
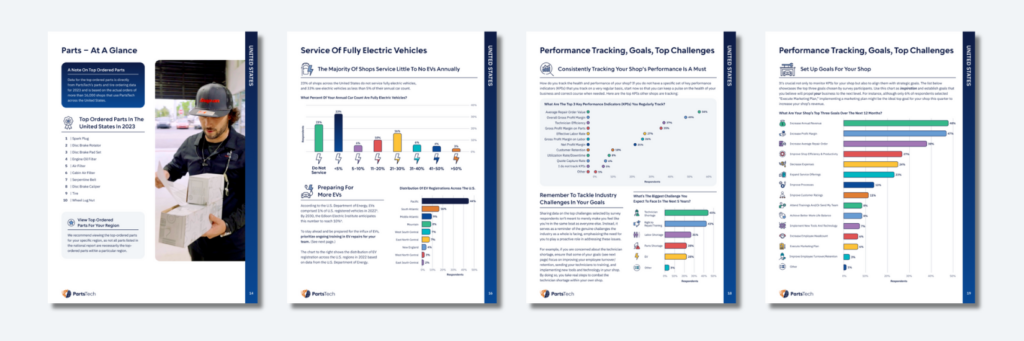
From insights on selling tires and servicing electric vehicles to anticipated challenges and top shop goals, this report covers a spectrum of topics to help you refine your business strategies.
You will also discover key findings. Here’s a glimpse of just a few:
- The national average annual revenue per bay stands at $203,000. Discover how your shop compares in your region.
- Hiring a second service advisor can significantly boost revenue, with tens of thousands more per bay. Find out the average number.
- 67% of surveyed shops need to update their parts markup strategy. Ensure your shop isn’t leaving money on the table.
Download The Report And Drive Your Success
Unlock the full potential of your shop by downloading the report today.
*References within the report.

You may also like
On-Demand Webinar: How to markup automotive parts (Part 2)
Watch Part 1 of this webinar series to help your shop begin to approach and tackle parts markup in a healthy way.
Find Out More

On-Demand Webinar: How to markup automotive parts (Part 1)
Many shop owners grapple with the crucial question of how much to mark up auto parts. Watch Part 1 of this webinar series to help your shop begin to approach and tackle parts markup in a healthy way.
Find Out More
The Right to Repair Act in a nutshell
If you work in the auto aftermarket repair industry or rely on aftermarket repairs for your vehicle, it’s crucial to understand the urgency of the Right to …
Find Out More